

Fishbone analysis for defects organizes possible causes into branches around a clearly stated effect. The resulting diagram is also known as an Ishikawa diagram or cause-and-effect diagram.
This structure brings operational knowledge together and helps identify factors that might otherwise be overlooked. Treat a completed diagram as a map of possibilities, not proof of a root cause. Examine each proposed cause against evidence before choosing corrective action.
The diagram’s structure, the adaptation of common cause categories, and the conduct of a practical investigation are explained in this article. The 5 Whys is also examined as a way to explore promising branches and trace possible causes toward the mechanisms behind defects.
Key Takeaways
- Define the defect as a clear, observable effect before possible causes are brainstormed.
- Use the traditional 6M categories as a starting point, then adapt them to the process and problem being investigated.
- Separate possible causes from verified causes by comparing leading branches with operational evidence.
- Apply the 5 Whys to promising causes to trace contributing factors toward underlying mechanisms.
- Assign corrective actions to verified causes, with owners and measures for assessing whether the defect has been reduced.
WHAT IS A FISHBONE DIAGRAM?
In fishbone analysis for defects, possible causes are arranged around a clearly defined defect, called the effect. The diagram structures the investigation; it does not prove that any cause is responsible.
Mapping Potential Causes
Mapping potential causes means placing an observable defect at the diagram’s head, then extending possible contributing factors from its backbone. Kaoru Ishikawa, the Japanese quality control expert credited with inventing the diagram, popularized it in the 1960s. Through this structure, brainstorming can be organized and relationships between a defect and possible causes made visible.
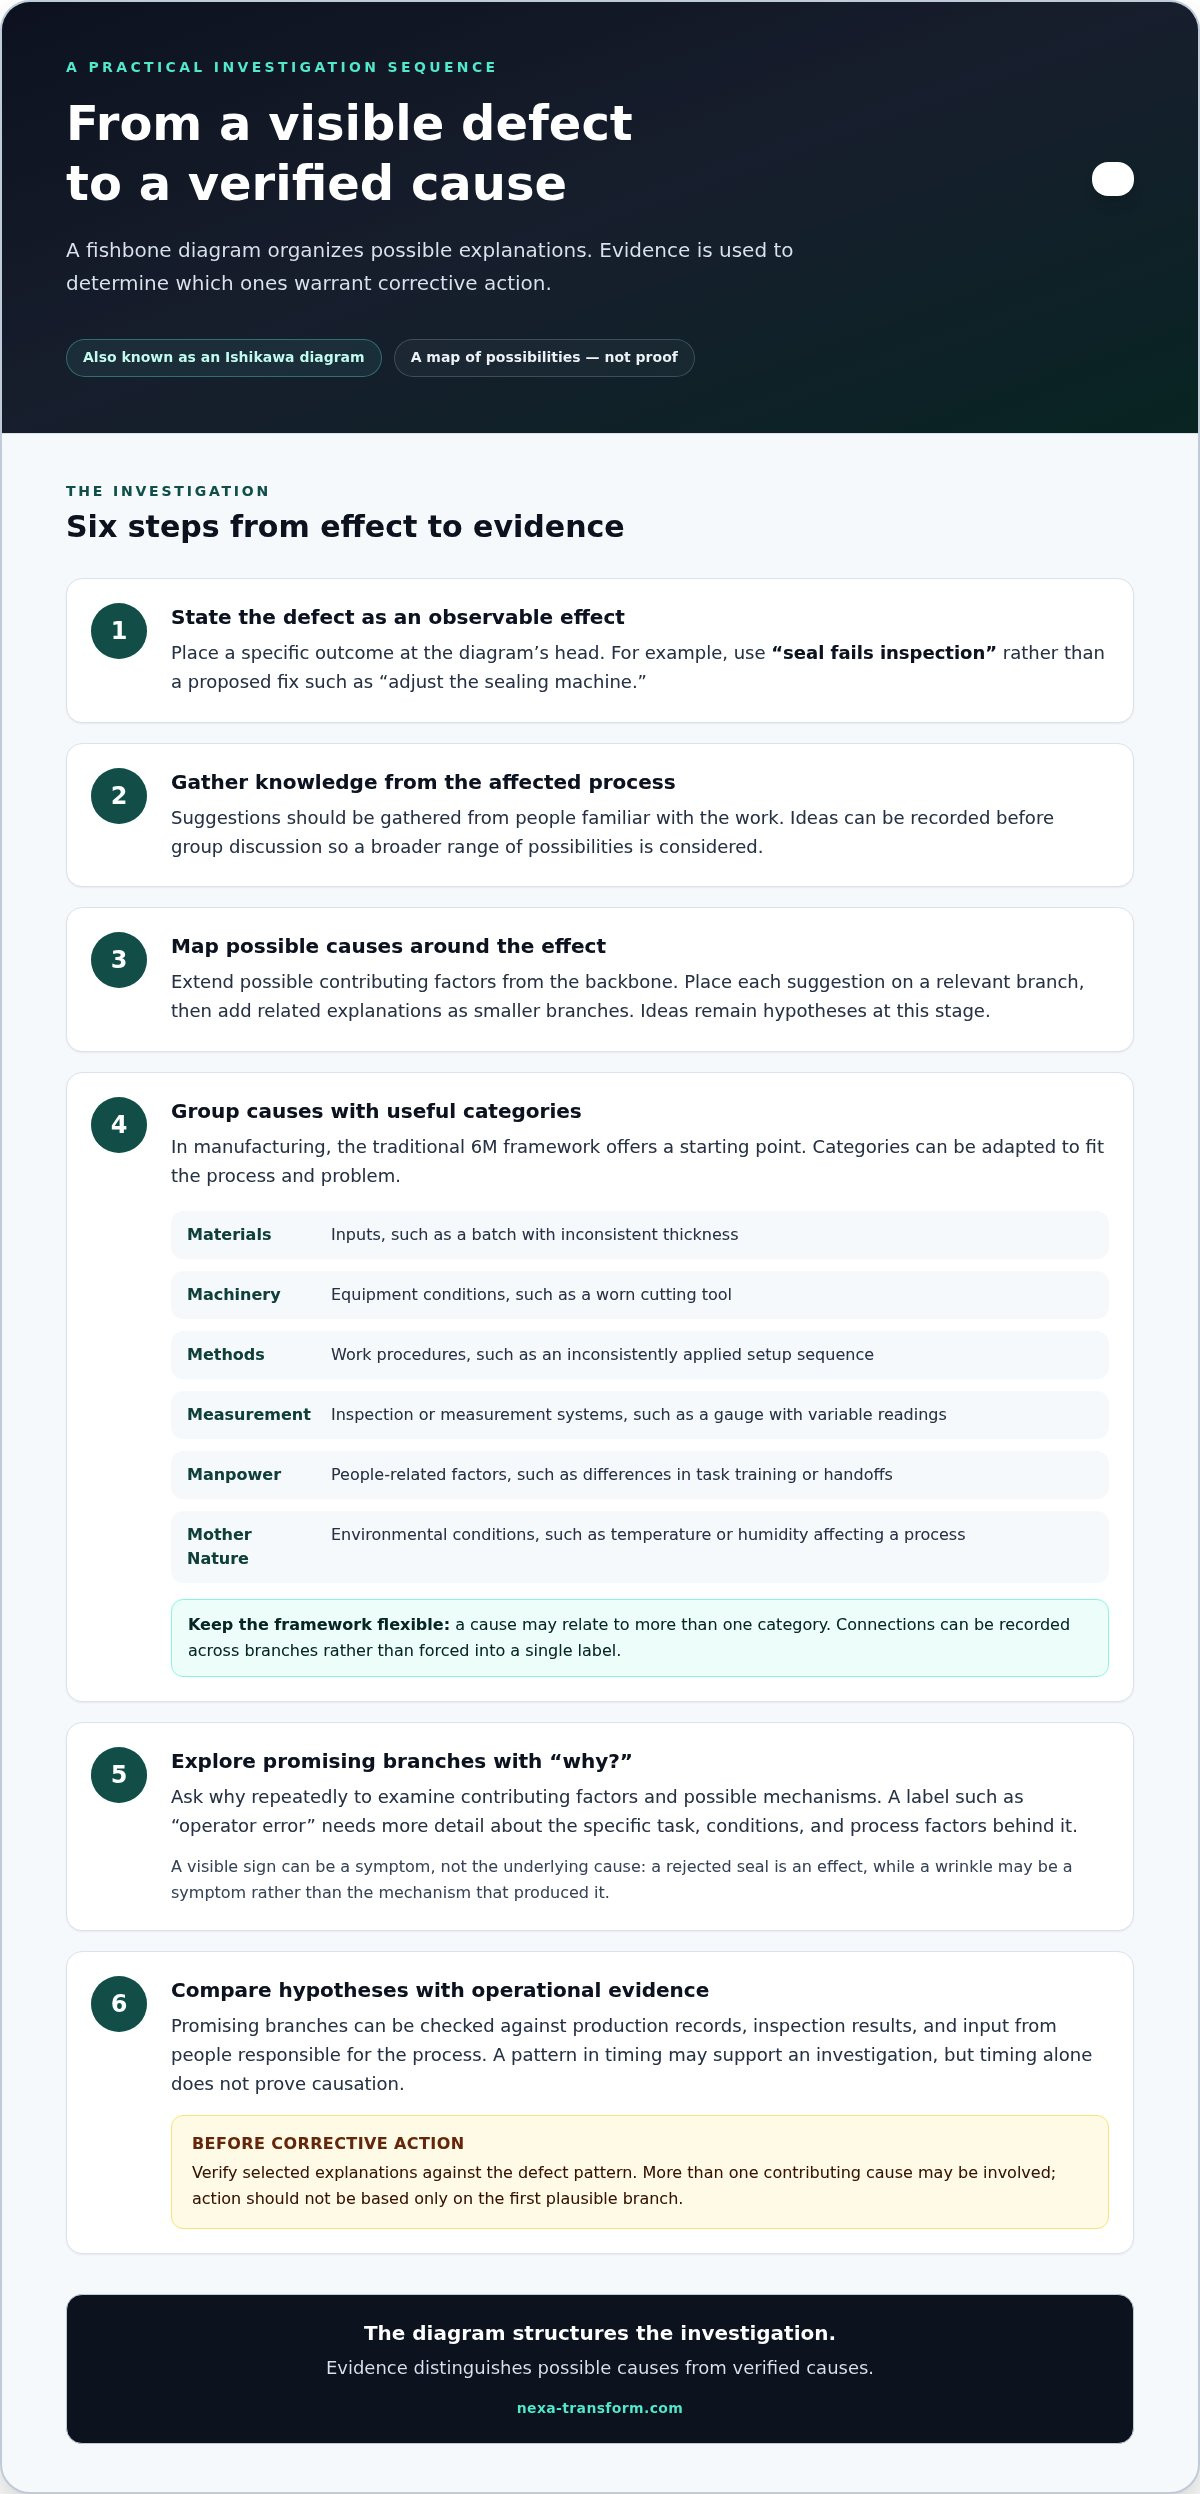
Start with a specific, observable effect, such as “seal fails inspection,” rather than a proposed fix like “adjust the sealing machine.” Gather suggestions from people familiar with the affected process, ideally before group discussion. Record each idea on a relevant branch and add related explanations as smaller branches. Ask why repeatedly to explore deeper causes, without treating an initial suggestion as fact.
Distinguishing Root Causes from Symptoms
A root cause is an underlying condition that contributes to the effect; a symptom is an observable sign of the defect. For example, a rejected seal is an effect, while a visible wrinkle may be a symptom rather than the mechanism that caused it. This distinction matters because an action aimed only at the visible defect may leave the underlying process condition unchanged.
During an Ishikawa investigation, examine each proposed cause through evidence and further questioning. If “operator error” appears on the diagram, identify the specific task, conditions, and process factors behind that label. On its own, the phrase is a possible explanation, not a verified root cause. Several contributing causes may emerge, so do not stop at the first plausible branch.
Brainstorming is most useful when it produces a broad, organized set of hypotheses rather than an immediate verdict. The facilitator can keep discussion focused on the effect, record ideas without assigning blame, and ask for observable examples. For a recurring dimensional defect, suggestions might include a changed setup method, inconsistent material, or a measurement issue. These are hypotheses to investigate, not established causes.
The diagram is one of the seven basic quality tools. Its fish-skeleton form supports discussion, but it does not automatically rank major causes above minor ones. After brainstorming, compare promising branches with production records, inspection results, and input from people responsible for the process. Prioritize based on evidence, not on how often an idea was mentioned.
Before implementing corrective action, test each selected hypothesis against the defect pattern. If defects occur only after a particular setup change, the timing may support investigating the method, but timing alone does not prove causation. More than one root cause may be involved. The diagram provides a structured path from effect to testable explanations; verification determines which explanations warrant action.
Cause categories
Related explanations are grouped into cause categories so the diagram can be reviewed systematically. In manufacturing, the traditional 6M framework is used as a starting point, not a fixed limit.
The Manufacturing 6M Categories
The 6M framework is used to organize potential manufacturing causes under six broad labels. With these categories, distinct parts of production can be examined without allowing one familiar explanation to dominate.
- Materials: inputs, such as a batch with inconsistent thickness.
- Machinery: equipment conditions, such as a worn cutting tool.
- Methods: work procedures, such as a setup sequence applied inconsistently.
- Measurement: inspection or measurement systems, such as a gauge producing variable readings.
- Manpower: people-related factors, such as differences in task training or handoffs.
- Mother Nature: environmental conditions, such as temperature or humidity affecting a process.
These categories are general guides, so a cause may fit more than one branch. A tool change, for example, may relate to both machinery and methods if a work procedure sets the replacement timing. Recording the connection across branches preserves context instead of imposing an artificial choice.
Other Cause Categories
Other category systems can be selected when the 6 Ms do not represent a process clearly. This flexibility matters because different causal factors are encountered in service operations, product design, and manufacturing.
Some manufacturing teams use five-category systems, while others expand the framework to eight categories. Money may be included as a seventh M to represent operating expenses and capital investments. Some service industries use a four-category alternative. Labels can also be customized to suit the product and problem.
For a delayed service response, for example, the team might distinguish information flow, staffing, process steps, and technology. These labels are useful only when evidence can be linked to them and they clarify the lines of inquiry. The diagram should make the causes easier to understand, not preserve a traditional format at the expense of relevance.
Brainstorming and Grouping Causes
During brainstorming, gather possible causes first, then assign them to the categories that best describe their relationship to the effect. This order matters: grouping ideas too early can narrow discussion before the team has considered the process fully.
In a manufacturing investigation, team members might suggest observations such as a shift change, material variation, or inspection delay. Record ideas in plain language under relevant branches. If an idea fits multiple categories, connect it to both rather than discarding or oversimplifying it.
After the ideas have been grouped, root cause analysis can be focused on branches with observable links to the defect. Production records can be used to distinguish a recurring equipment condition from a one-off event. Causation is not established by a category alone; hypotheses are organized for validation and prioritization. For a more structured investigation, root cause analysis can help connect cause categories with evidence and corrective action.
Steps for creating a fishbone diagram
A fishbone diagram, also called an Ishikawa diagram, maps cause and effect around a defined problem. Its structure supports quality improvement by turning a defect investigation into organized, testable lines of inquiry.
Common mistakes include defining the problem vaguely, treating brainstormed ideas as proven causes, and stopping at visible symptoms. For example, “poor quality” gives a team less direction than “misaligned labels found during final inspection.”
A fishbone diagram can be created on a whiteboard, paper, spreadsheet, or diagramming software. The essential requirement is a visible structure for recording the effect, cause branches, and supporting evidence.
Build the diagram in a sequence that keeps the investigation connected to the actual defect:
- Define the problem statement. Describe one observable effect, such as “labels are misaligned at final inspection.” Avoid defining the problem as a solution, such as “the label guide needs adjustment.”
- Draw the backbone. Place the problem statement at the right-hand end as the fish’s head. Extend a horizontal line toward the left to represent the central cause-and-effect relationship.
- Add primary branches. Label them with suitable cause categories, such as the manufacturing 6M categories. Categories keep the investigation broad enough to consider materials, equipment, methods, measurement, people, and environment.
- Invite process knowledge. Include people familiar with setup, production, inspection, and maintenance. Ask each member to suggest possible causes, then record ideas without presenting them as verified facts.
- Build secondary branches. Connect each possible cause to a relevant category. For example, “guide alignment varies” might branch from equipment, while “setup sequence differs” might branch from methods.
- Review and investigate. Identify branches that can be compared with production records, inspection results, or direct process observations. Prioritize hypotheses using evidence, not their position on the diagram.
As branches develop, the 5 Whys can be applied beneath each primary category. For a suspected setup issue, ask why the guide is misaligned, then continue asking why each answer occurs, drilling into each possibility five times. The resulting chain may expose a deeper process condition, but every link still requires validation before an action is chosen.
To assess whether corrective actions reduce defects, compare relevant defect counts or rates before and after implementation. Use the same inspection definition and comparable production conditions, then monitor the selected outcome measure during follow-up. A reduction in recorded defects supports the action’s effectiveness; recurring defects signal that causes or controls need further investigation.
During quality improvement, treat the diagram as a working record, not a final verdict. For example, support a “material variation” branch with incoming inspection or production evidence before assigning corrective action. Assigning owners, milestones, and follow-up measures then connects the investigation to execution.
Simple example: customer complaints about paper bags
Suppose complaints say that paper-bag handles separate during use. The effect statement should describe that specific failure, rather than the broad phrase “poor bag quality.” A fishbone diagram can then organize possible explanations, including adhesive condition, paper strength, handle placement, bonding method, inspection measurement, and storage environment.
Each explanation remains a hypothesis. For example, if complaints involve bags from different production runs, compare material batches and bonding methods with complaint records. If failures cluster around one handle position, measurements and process observations can help narrow the investigation. This is cause analysis, not proof that the most visible branch is the root cause.
Kaoru Ishikawa’s diagram is often drawn as a skeleton, with the effect at the head and possible causes branching from its backbone. For the paper-bag example, team members can add evidence beneath each branch. A recorded adhesive change, variation in paper thickness, or recurring storage condition gives the next investigation step a concrete basis.
Inspection data can also define the scale of a manufacturing problem. One example states that 12% of a product fails inspection. That figure describes the effect; an Ishikawa analysis can help structure possible causes, while inspection records are examined for patterns by product, process, or production condition. A separate example describes using a fishbone diagram to help reduce defects by 19%.
More complex products call for broader branches. For suspected iron contamination, possible causes could be examined across raw materials, equipment, methods, measurement, people, and environment. These categories help investigators consider where contamination may enter, how it may transfer, and how it is detected. Testing and process evidence are needed to distinguish plausible routes from the actual cause.
A food and beverage manufacturing scenario describes unplanned line stops increasing by 20% over the last two weeks on the night shift. The statement defines the effect and time pattern; the diagram can organize possible causes such as equipment condition, setup method, material supply, or shift handoff. Production logs can then be compared with stop times to prioritize branches.
Other industries use the same visual logic. Nyaho Medical Centre recorded 11 staff needlestick injuries in 2018 and 2 cases in 2021, after improvement ideas were tested. Across paper packaging, manufacturing, food production, and healthcare, the diagram organizes possible causes; follow-up evidence determines which actions should be retained.
Combining fishbone analysis with 5 Whys
A fishbone diagram organizes possible causes; the 5 Whys technique investigates selected branches in greater depth. Used together, these tools connect a structured overview of cause-and-effect relationships with focused questioning about how a defect develops.
Begin with a defined effect, such as a machined shaft failing its diameter inspection. The diagram may identify methods, machinery, materials, and measurement as relevant branches. The 5 Whys should then be applied beneath each promising possibility, rather than only to the first explanation raised during brainstorming.
For example, a team might investigate a possible setup issue through this illustrative chain:
- Why did the shaft fail inspection? Its measured diameter was outside the required range.
- Why was the diameter outside the range? The cutting tool had worn during production.
- Why was the worn tool still in use? A scheduled inspection was missed.
- Why was that inspection missed? The shift handoff record did not capture the required check.
- Why did the record omit the check? The handoff process had not been revised to include that control.
This chain identifies a process condition for further investigation, not automatic proof of a root cause. Compare inspection records, tool history, and handoff documentation with the defect pattern. If the evidence does not support a link, revise the chain or examine another branch.
The five questions are a disciplined prompt, not a requirement to accept the fifth answer without validation. Some branches reach a testable explanation sooner; others reveal several contributing conditions. Asking why repeatedly can also expose symptoms presented as causes. “Operator missed the check,” for instance, describes an event; examining the handoff design may reveal an underlying process weakness.
Applying the technique within each primary category helps prevent premature focus on a single relationship. A material branch may point to variation in incoming stock, while a measurement branch may indicate inconsistent inspection. Explore each possibility separately, then compare it with production data and input from responsible team members.
Fishbone analysis can produce relevant and irrelevant hypotheses, so prioritization is essential. Rank branches using evidence, process knowledge, and each cause’s connection to the observed effect. In a DMAIC investigation, the diagram is commonly used during Analyze; verified causes can then inform improvement actions and follow-up measures.
The practical takeaway is to use the fishbone for breadth and the 5 Whys for depth. The diagram exposes relationships across the process; repeated questioning develops selected branches into testable explanations. Corrective action should be based on evidence for the underlying cause, not simply the most convincing chain or the most visible symptom.
Nexa Transform Group: Website Designing & Hosting
Nexa Transform Group helps organizations address process or information-flow issues identified through defect investigations. Business Process Management (BPM) can structure workflows, while Workflow Automation & Digital Forms and Custom Digital Systems can support process changes with tailored digital solutions.
Nexa Transform Group also designs and hosts websites. For operational defect work, the next step is to connect verified causes to the process changes required, then determine whether workflow or system design needs improvement.
Contact Nexa Transform Group to discuss your operational challenge and the appropriate next step.
Turn Verified Causes into Lasting Process Change
A defect investigation creates operational value when its findings are carried into daily work. Translate verified causes into clearly owned process changes, then keep those changes visible through routine review. This helps prevent corrective actions from becoming isolated fixes while the conditions that produced the defect remain unchanged.
Fishbone analysis for defects is most effective when investigation and execution are connected. Nexa Transform Group offers Business Process Management (BPM) and Workflow Automation & Digital Forms to support process improvements, as well as Website Designing & Hosting. These services can help when operational changes need clearer workflows or digital support.
For support aligning process findings with practical improvements, contact Nexa Transform Group. A disciplined next step can turn investigation into measurable operational progress.
Frequently Asked Questions
How is fishbone analysis used in manufacturing?
In manufacturing, fishbone analysis organizes potential contributors to a production or inspection problem. For example, if a coating defect appears on products from one production run, compare process records, material details, equipment settings, and inspection results to identify which lines of investigation deserve attention. The diagram supports structured review; process evidence is still needed before choosing corrective action.
What is fishbone analysis for defects?
Fishbone analysis for defects is a cause-and-effect investigation method that maps possible reasons for a defined quality problem. The effect is recorded at one end of the diagram, with branches capturing candidate causes and their relationships. It is useful when a team needs a shared view of the issue before testing explanations. For instance, a recurring packaging fault can be examined across production, materials, inspection, and handling.
How does a fishbone diagram identify defect root causes?
A fishbone diagram identifies candidate causes by making them visible and organized, but it doesn’t establish root cause on its own. A team can compare each candidate with the timing, location, or process conditions associated with defects. If a fault appears only after a particular production change, that pattern can guide investigation. Records, observations, and targeted tests then help establish whether the suspected relationship is supported.
What are the main categories in a fishbone diagram for defect analysis?
The traditional manufacturing categories are Materials, Machinery, Methods, Measurement, Manpower, and Mother Nature. They provide distinct prompts, such as checking input variation separately from equipment condition or inspection practice. A team can adapt the labels when another structure better reflects the operation. For example, a service process may need categories focused on information handoffs and systems rather than raw materials. Choose labels that help locate evidence, not simply complete a standard template.
What steps are used to create a fishbone analysis for defects?
Start by defining the defect precisely, then set up the effect and relevant cause branches. People familiar with the affected operation can contribute possible explanations, recorded in specific terms. The team can then identify which explanations need investigation and what evidence could support or disprove them. For a packaging issue, this may mean reviewing where damage first appears in production and comparing the findings with inspection records.
How do you prioritize and verify causes identified in a fishbone diagram?
Prioritize causes by comparing their connection to the defect with available process evidence. A hypothesis that matches the fault’s timing or location deserves investigation, while an unsupported suggestion remains unverified. Test the relationship using production logs, inspection records, and direct observations. If several branches seem plausible, assess them separately and record the evidence for each. Corrective action should follow validation, not brainstorming popularity.
What is the difference between fishbone analysis and 5 Whys for defects?
Fishbone analysis lays out multiple possible cause paths, while 5 Whys investigates one selected path through repeated questioning. The diagram is useful when the defect could have several contributing factors; the questioning technique adds depth to a specific hypothesis. For example, a team might map causes of a failed assembly, then ask why a suspected alignment issue occurred. Evidence should be checked along the chain before its final answer is treated as a root cause.
Can you show an example fishbone analysis for a manufacturing defect?
Consider a hypothetical assembly in which a fastener is found loose during final inspection. Record the effect as “fastener fails torque check.” Possible branches might include the fastener batch, tool condition, assembly method, torque measurement, and work instruction. Compare inspection records with tool checks and assembly observations. If the findings point to a specific condition, test that cause before implementing corrective action.


